I figured this out.
In my Solution, I have a website project and some API projects.
The Chart was generated in an API call and displayed on the webpage.
So I should have registered the TChart component in the API, not the website.
Thanks for your help.
ja
Search found 54 matches
- Wed May 29, 2024 6:30 pm
- Forum: .NET
- Topic: Error Compiling in Azure After Adding Steema .Net License File
- Replies: 2
- Views: 609
- Wed May 29, 2024 4:24 pm
- Forum: .NET
- Topic: Error Compiling in Azure After Adding Steema .Net License File
- Replies: 2
- Views: 609
Error Compiling in Azure After Adding Steema .Net License File
I added the license file for TeeChart.Net to my asp.net project and it compiles fine locally - but in Azure the build files with: Error CS0246: The type or namespace name 'EntryAssemblyAttribute' could not be found (are you missing a using directive or an assembly reference?) I know it's probably so...
- Sun May 26, 2024 5:40 am
- Forum: .NET
- Topic: Volume Series Drawing tiny boxes with Prices Everywhere --
- Replies: 1
- Views: 504
Re: Volume Series Drawing tiny boxes with Prices Everywhere --
Figured it out - volumeJA.Marks.Visible = false;
Series.Marks.Visible = false fixed it.
Thanks.
ja
Series.Marks.Visible = false fixed it.
Thanks.
ja
- Sun May 26, 2024 5:25 am
- Forum: .NET
- Topic: Volume Series Drawing tiny boxes with Prices Everywhere --
- Replies: 1
- Views: 504
Volume Series Drawing tiny boxes with Prices Everywhere --
I created an app that makes a chart with a volume series then I writes it out to a file. It works fine in a Winforms test app. But when I move it to an Asp.Net page the chart is printing hundreds of tiny prices all over the chart. I'm not sure how to turn it off. I'm sure I can figure it out eventua...
- Sun May 12, 2024 4:27 pm
- Forum: .NET
- Topic: Programmatic Chart Creation and Saving to Disk
- Replies: 4
- Views: 1156
Re: Programmatic Chart Creation and Saving to Disk
Nevermind - doyyy -
I just wired up the API Version of TChart to its AfterDraw event handler and did the drawing the same as the WinForms Version and it works -- thanks for your help!
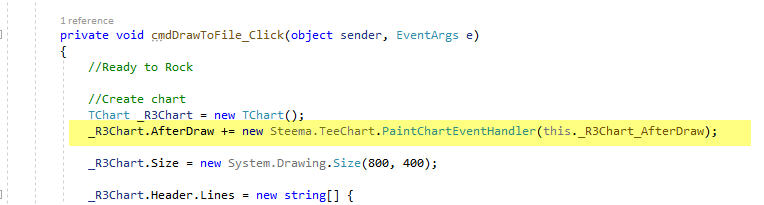
I just wired up the API Version of TChart to its AfterDraw event handler and did the drawing the same as the WinForms Version and it works -- thanks for your help!
- Sun May 12, 2024 4:13 pm
- Forum: .NET
- Topic: Programmatic Chart Creation and Saving to Disk
- Replies: 4
- Views: 1156
Re: Programmatic Chart Creation and Saving to Disk
So I tried the code and it works but I'm having trouble writing custom text out to "graphics" object - normally this text is written in the "BeforeDraw" event when using WinForms - but in API style no events are thrown so I thought I could access the "g" graphics object passed in the DrawEvents and ...
- Tue May 07, 2024 2:04 pm
- Forum: .NET
- Topic: Programmatic Chart Creation and Saving to Disk
- Replies: 4
- Views: 1156
Re: Programmatic Chart Creation and Saving to Disk
Thanks so much!
- Sun May 05, 2024 3:26 am
- Forum: .NET
- Topic: Programmatic Chart Creation and Saving to Disk
- Replies: 4
- Views: 1156
Programmatic Chart Creation and Saving to Disk
Hi Fellow TChart Devs, I was curious if there's an example of programmatically generating charts using TChart.Net then saving chart pic to a disk file. In other words to use in an API without WinForms. I searched here and on YouTube and didn't find anything. It would save me a lot of time. Thanks, ja
- Wed Aug 03, 2022 6:17 pm
- Forum: .NET
- Topic: Set Axis and Zoom in Form Load Wonky
- Replies: 3
- Views: 4822
Re: Set Axis and Zoom in Form Load Wonky
Hi Marc, I tried the AfterDraw code change you suggested and the Zoom still doesn't work. I tried messing around a little bit with UndoZoom first and DoEvents but still no Zoom using AfterDraw. I've attached my code in case that's helpful and have the whole VS 2019 Project with just the repro code i...
- Mon Aug 01, 2022 3:57 pm
- Forum: .NET
- Topic: Set Axis and Zoom in Form Load Wonky
- Replies: 3
- Views: 4822
Re: Set Axis and Zoom in Form Load Wonky
I will give this a try. Thanks very much Marc!
- Sun Jul 31, 2022 8:00 am
- Forum: .NET
- Topic: Set Axis and Zoom in Form Load Wonky
- Replies: 3
- Views: 4822
Set Axis and Zoom in Form Load Wonky
Hi Steema - I'm building an app and trying to set the TChart Axes and Zoom during form Load - The Set Axes works but not the Zoom - But if I set the Axes and Zoom with the same code from buttons on the form once loaded it works. I'm sure it's an event sequencing issue of some sort but can't figure i...
- Tue Jul 19, 2022 8:46 pm
- Forum: .NET
- Topic: Read Zoomed Values
- Replies: 2
- Views: 4987
Re: Read Zoomed Values
Thanks, I will try this.
- Sat Jun 18, 2022 12:44 pm
- Forum: .NET
- Topic: Iterate through Chart and Scrape Bollinger Upper, Lower, and Middle Band Values???
- Replies: 2
- Views: 5184
- Sat Jun 18, 2022 12:42 pm
- Forum: .NET
- Topic: Read Zoomed Values
- Replies: 2
- Views: 4987
Read Zoomed Values
Hi Steema,
When I zoom into a chart I'd like to get the zoomed MinX , MinY, MaxX, and MaxY values and thought it would be in the Zoomed event but am finding it challenging to figure this out. Please see attached screenshots. I'm doing something wrong.
Thanks as always!
Joseph
When I zoom into a chart I'd like to get the zoomed MinX , MinY, MaxX, and MaxY values and thought it would be in the Zoomed event but am finding it challenging to figure this out. Please see attached screenshots. I'm doing something wrong.
Thanks as always!
Joseph
- Sun May 08, 2022 8:52 am
- Forum: .NET
- Topic: Iterate through Chart and Scrape Bollinger Upper, Lower, and Middle Band Values???
- Replies: 2
- Views: 5184
Iterate through Chart and Scrape Bollinger Upper, Lower, and Middle Band Values???
Hi Steema Techs,
I would like to iterate through all the Values on a chart and Scrape the Bollinger Values for Upper, Lower, and Middle band as well as Date.
Do you have any sample code anywhere that shows how to do this?
I only see X and Y values.
Thanks so much,
Joseph
I would like to iterate through all the Values on a chart and Scrape the Bollinger Values for Upper, Lower, and Middle band as well as Date.
Do you have any sample code anywhere that shows how to do this?
I only see X and Y values.
Thanks so much,
Joseph