Tutorial 18 - The TeeChart Tool Collection
Contents
Introduction Series Tools
Cursor Tool
Design-time
Run-time
Drag Marks Tool
Design-time
Run-time
Drag Point Tool
Design-time
Run-time
Draw Line Tool
Design-time
Run-time
Gantt Drag Tool
Design-time
Run-time
Image Tool
Design-time
Run-time
Mark Tips Tool
Design-time
Run-time
Nearest Point Tool
Design-time
Run-time
Pie Slices Tool
Design-time
Run-time
Series Animation Tool
Design-time
Run-time
Extra Legend Tool
Design-time
Run-time
Surface NearestTool
Design-time
Run-time
Fibonacci Tool
Design-time
Run-time
Series Region Tool
Design-time
Run-time
Legend Palette Tool
Design-time
Run-time
Series Statistics Tool
Design-time
Run-time
Clip Series Tool
Design-time
Run-time
Axis Tools
Axis Arrows Tool
Design-time
Run-time
Color Band Tool
Design-time
Run-time
Color Line Tool
Design-time
Run-time
Grid Band Tool
Design-time
Run-time
Axis Scroll Tool
Design-time
Run-time
WebChart Tools
Hotspot Tool
Scroll Tool
Zoom Tool
Other Tools
3D Grid Transpose Tool
Design-time
Run-time
Annotation Tool
Design-time
Run-time
Page Number Tool
Design-time
Run-time
Rotate Tool
Design-time
Run-time
Legend ScrollBarTool
Design-time
Run-time
2D Lighting Tool
Design-time
Run-time
SubChart Tool
Design-time
Run-time
Fader Tool
Design-time
Run-time
Rectangle Tool
Design-time
Run-time
Selector Tool
Design-time
Run-time
Transpose Series Tool
Design-time
Run-time
DataTable Tool
Design-time
Run-time
Banner Tool
Design-time
Run-time
Magnify Tool
Design-time
Run-time
Introduction
This tutorial focuses on the TeeChart for .Net Tools, easily implemented units of code with which you or your application's users can add extra functionality to TeeCharts. There are ten new tools to deploy: Series Tools
Cursor Tool The Cursor Tool adds cursors to the Chart which can be associated with individual series or with the Chart as a whole. Cursors may be horizontal, vertical or both (crosshair).
Drag Marks Tool
The Drag Marks Tool allows the mousedrag of Marks for the selected Series.
Drag Point Tool
The Drag Marks Tool allows the mousedrag of Marks for the selected Series.
Draw Line Tool
The Draw Line Tool enables fully customisable lines to be drawn, selected, dragged and deleted on the Chart with the mouse.
Gantt Drag Tool
The Gantt Drag Tool enables the bars of Gantt Series to be dragged and/or resized.
Image Tool
The Image Tool draws a picture (bitmap, jpeg, gif, png, pcx) behind a specified chart Series.
Mark Tips Tool
The Marks Tip tool is used to display default Hint windows when the mouse is over (or clicks) a Series point.
Nearest Point Tool
The Nearest Point Tool moves a marker to the point nearest to the cursor. The tool may be associated with a Series or applied globally to the Chart.
Pie Slices Tool
The Pie SlicesTool highlights the pie slice under the mouse either by drawing a border around it or by exploding it away from the rest of the Pie Series.
Series Animation Tool
The Series Animation Tool performs a growing animation of Series Points.
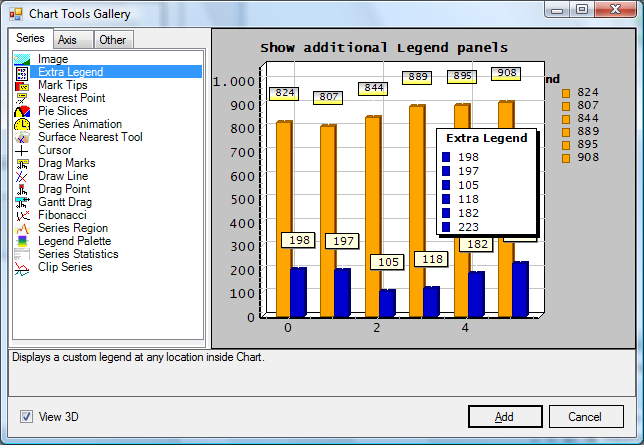
Extra Legend Tool
The Extra Legend Tool displays a custom legend at any location inside the Chart.
Surface Nearest Tool
The Surface Nearest Tool displays a visual indication of selecting a Surface cell when the user moves the mouse over a surface series.
Fibonacci Tool
The Fibonacci Tool displays Fibonacci arcs or fans based on specified trendline.
Series Region Tool
The Series Region Tool paints an area under the series curve.
Legend Palette Tool
The Legend Palette Tool displays legend made with 3D series palette colors.
Series Statistics Tool
The Series Statistics Tool calculates a number of standard statistical measures for a given series.
Clip Series Tool
The Clip Series Tool restricts Series painting outside Series associated axes boundaries.
Axis Tools
Axis Arrows Tool The Axis Arrow Tool displays configurable arrows at the beginning and end of axes. These arrows can be made to scroll the axes when clicked upon.
Color Band Tool
The Color Band Tool adds bands of configurable color to the interior region enclosed by the Chart axes. These bands may be set vertically or horizontally in line with the axis values.
Color Line Tool
The Color Line Tool adds colored lines to the Chart which can be set vertically or horizontally in line with the axis values.
Grid Band Tool
The Grid Band Tool d isplays colored rectangles (bands) at the grid lines of the specified axis and position.
Axis Scroll Tool
The Axis Scroll Tool a llows the scrolling of Axes by mouse dragging.
Other Tools
3D Grid Transpose Tool The 3D Grid Transpose Tool exchanges X and Z coordinates to rotate a Grid-based series through 90 degrees.
Annotation Tool
The Annotation Tool allows text to be displayed on the Chart
Page Number Tool
The Page Number Tool displays a fully configurable text box containing a chosen page numbering system.
Rotate Tool
The Rotate Tool changes the elevation and rotation of charts when dragging the mouse over a chart.
Legend ScrollBar Tool
The Legend ScrollBar Tool allows the scrolling of Axes by mouse dragging.
2D Lighting Tool
The 2D Lighting Tool displays a 2 dimensional "light" effect over the chart Canvas.
SubChart Tool
The SubChart Tool allows multiple Charts inside a single Chart.
Fader Tool
The Fader Tool effectuates a fade-in or fade-out Chart animation.
Rectangle Tool
The Rectangle Tool is an Annotation tool that can be dragged and resized.
Selector Tool
The Selector Tool enables the end-user to click and drag chart elements like series, axes, legend, titles, etc..
Transpose Series Tool
The Transpose Series Tool swaps multiple series rows and columns.
Data Table Tool
The Data Table Tool displays an Excel-like table besides vertical or horizontal axes.
Banner Tool
The Banner Tool produces a scrolling and blinking text animation.
Magnify Tool
The Magnify Tool magnifies a portion of the chart.
At design-time these Tools are added by clicking on the Add... button of the Tools Tab within the Chart Editor:

At run-time only a few simple lines of code are necessary.
3D Grid Transpose Tool
The 3D Grid Transpose Tool exchanges X and Z coordinates to rotate a Grid-based series through 90 degrees. Design-time

Use the Grid3D Series ComboBox to select the series to rotate.
Run-time
Adding an 3DGrid Transpose Tool at runtime is a straightforward operation, as can be seen in the example below:
[C#]
private void Form1_Load(object sender, System.EventArgs e)
        Surface surface1 = new Surface(tChart1.Chart);
        GridTranspose gridTranspose1 = new GridTranspose(tChart1.Chart);
        gridTranspose1.Series = surface1;
        surface1.FillSampleValues(20);


private void button1_Click(object sender, System.EventArgs e)
        ((GridTranspose)tChart1.Tools[0]).Transpose();


[VB.Net]
Private Sub Form1_Load(ByVal sender As System.Object, ByVal e As System.EventArgs) Handles MyBase.Load
        Dim Surface1 As New Steema.TeeChart.Styles.Surface(TChart1.Chart)
        Dim GridTranspose1 As New Steema.TeeChart.Tools.GridTranspose(TChart1.Chart)
        Surface1.FillSampleValues(20)
        GridTranspose1.Series = Surface1
End Sub

Private Sub Button1_Click(ByVal sender As System.Object, ByVal e As System.EventArgs) Handles Button1.Click
        CType(TChart1.Tools(0), Steema.TeeChart.Tools.GridTranspose).Transpose()
End Sub
Annotation Tool
The Annotation Tool allows text to be displayed on the Chart. Design-time

The Text of the Annotation Tool and the box it sits in can both be fully configured. The Options tab allows you to enter the text you wish and to specify its position either by default or custom values. The Format tab configures the text box, allowing you to change its colour, frame, pattern, bevel, size, roundness and transparency. The Text tab enables the setting of the text font, colour, outline and spacing and also the colour and size of the text shadow. The Gradient tab configures the properties of the text-box gradient, the Shadow tab configures the properties of the text-box shadow while the Bevel tab configures the properties of the Annotation Tool bevels.
Run-time
Adding an Annotation Tool at runtime is a straightforward operation, as can be seen in the example below:
[C#]
private void Form1_Load(object sender, System.EventArgs e)
        Bar bar1 = new Bar(tChart1.Chart);
        Steema.TeeChart.Tools.Annotation annotation1 = new Steema.TeeChart.Tools.Annotation(tChart1.Chart);
        annotation1.Active = true;
        annotation1.Position = AnnotationPositions.LeftTop;
        annotation1.Text = "My Chart Text";

        bar1.FillSampleValues(20);


[VB.Net]
Private Sub Form1_Load(ByVal sender As System.Object, ByVal e As System.EventArgs) Handles MyBase.Load
        Dim Bar1 As New Steema.TeeChart.Styles.Bar(TChart1.Chart)
        Dim Annotation1 As New Steema.TeeChart.Tools.Annotation(TChart1.Chart)
        Annotation1.Active = True
        Annotation1.Position = Steema.TeeChart.AnnotationPositions.LeftTop
        Annotation1.Text = "My Chart Text"

        Bar1.FillSampleValues(20)
End Sub
Axis Arrows Tool
The Axis Arrow Tool displays configurable arrows at the beginning and end of axes. These arrows can be made to scroll the axes when clicked upon. Design-time
Once you have added an Arrow Tool a number of options become open to you. Axis enables to to select the axis (top, bottom, left, right or custom) to which you want to associate the Axis Tool. You may add more than one Axis Tool and associate each one with different axes. Border (Pen Editor) allows you to configure the style, colour, width, ending, transparency and visibility of the pen outlining the arrow shape while Fill (Hatch Brush Editor) allows you to configure the body of the arrow, it's colour, transparency, visibility, fill-style, fill-gradient or fill-image. Length descibes the length of the arrow in pixels, Position defines whether the arrows are drawn on the End, Start or at Both ends of the axis, Scroll defines the percentage of the axis length by which the axis will scroll when the arrows are clicked while Inverted Scroll defines in which direction the Arrows will scroll the chart.
Run-time
Adding an Axis Arrow Tool at runtime is a straightforward operation, as can be seen in the example below.
[C#]
private void Form1_Load(object sender, System.EventArgs e)
        Bar bar1 = new Bar(tChart1.Chart);
        AxisArrow axisArrow1 = new AxisArrow(tChart1.Chart);
        axisArrow1.Active = true;
        axisArrow1.Axis = tChart1.Axes.Left;

        bar1.FillSampleValues(20);


[VB.Net]
Private Sub Form1_Load(ByVal sender As System.Object, ByVal e As System.EventArgs) Handles MyBase.Load
        Dim Bar1 As New Steema.TeeChart.Styles.Bar(TChart1.Chart)
        Dim AxisArrow1 As New Steema.TeeChart.AxisArrow(TChart1.Chart)
        AxisArrow1.Active = True
        AxisArrow1.Axis = TChart1.Axes.Left

        Bar1.FillSampleValues(20)
End Sub
Color Band Tool
The Color Band Tool adds bands of configurable color to the interior region enclosed by the Chart axes. These bands may be set vertically or horizontally in line with the axis values. Design-time

There are a number of options to be able to configure the Color Band Tool once it's been added to your chart. Axis enables to to select the axis (top, bottom, left, or right) to which you want to associate the Color Band. Border (Pen Editor) allows you to configure the style, colour, width, ending, transparency and visibility of the pen outlining the arrow shape while Fill (Hatch Brush Editor) allows you to configure the body of the arrow, it's colour, transparency, visibility, fill-style, fill-gradient or fill-image. Gradient defines the visibility, direction and start, middle and end colours of the Color Band Gradient while Color, in the absence of a gradient or an image, defines the colour. Start value sets the start value on the specified axis from which the Color Band Tool will begin and End value sets the end value. Transparency is a value from 0 to 100 which sets the transparency of the Color Band Tool while Draw Behind enables/disables the drawing of it behind the Chart series.
Run-time
Adding an Color Band Tool at runtime is a straightforward operation, as can be seen in the example below:
Example
The Color Band Tool is very useful for highlighting a specific set of values within your series. In this example we are using a Color Band Tool which extends between the two dynamically specified YValues and whose transparency can be altered by the Scroll Bar. Color Bands can be drawn in front of or behind your TeeChart series.

[C#]
private void Form1_Load(object sender, System.EventArgs e)
        AreaSeries area1 = new AreaSeries(tChart1.Chart);
        ColorBand colorband1 = new ColorBand(tChart1.Chart);
        tChart1.Aspect.View3D = false;
        tChart1.Panel.Gradient.Visible = true;
        tChart1.Panel.Gradient.StartColor = Color.Blue;
        tChart1.Panel.Gradient.MiddleColor = Color.Gray;
        tChart1.Panel.Gradient.EndColor = Color.Green;

        area1.LinePen.Color = Color.Blue;
        area1.FillSampleValues(20);

        double offSet = area1.YValues.Maximum * 0.1;
        colorband1.Active = true;
        colorband1.Axis = tChart1.Axes.Left;
        colorband1.Transparency = 50;
        colorband1.Start = area1.YValues.Minimum + offSet;
        colorband1.End = area1.YValues.Maximum - offSet;
        colorband1.DrawBehind = false;
        hScrollBar1.Value = 50;


private void hScrollBar1_Scroll(object sender, System.Windows.Forms.ScrollEventArgs e)
        ((ColorBand)tChart1.Tools[0]).Transparency = e.NewValue;


private void checkBox1_CheckedChanged(object sender, System.EventArgs e)
        ((ColorBand)tChart1.Tools[0]).DrawBehind = !((ColorBand)tChart1.Tools[0]).DrawBehind;


[VB.Net]
Private Sub Form1_Load(ByVal sender As System.Object, ByVal e As System.EventArgs) Handles MyBase.Load
        Dim Area1 As New Steema.TeeChart.Styles.Area(TChart1.Chart)
        Dim Colorband1 As New Steema.TeeChart.ColorBand(TChart1.Chart)
        TChart1.Aspect.View3D = False
        TChart1.Panel.Gradient.Visible = True
        TChart1.Panel.Gradient.StartColor = Color.Blue
        TChart1.Panel.Gradient.MiddleColor = Color.Gray
        TChart1.Panel.Gradient.EndColor = Color.Green

        Area1.LinePen.Color = Color.Blue
        Area1.FillSampleValues(20)

        Dim OffSet As Double = Area1.YValues.Maximum * 0.1
        Colorband1.Active = True
        Colorband1.Axis = TChart1.Axes.Left
        Colorband1.Transparency = 50
        Colorband1.Start = Area1.YValues.Minimum + OffSet
        Colorband1.End = Area1.YValues.Maximum - OffSet
        Colorband1.DrawBehind = False
        HScrollBar1.Value = 50
End Sub

Private Sub HScrollBar1_Scroll(ByVal sender As Object, ByVal e As System.Windows.Forms.ScrollEventArgs) Handles HScrollBar1.Scroll
        CType(TChart1.Tools(0), Steema.TeeChart.ColorBand).Transparency = e.NewValue
End Sub

Private Sub CheckBox1_CheckedChanged(ByVal sender As Object, ByVal e As System.EventArgs) Handles CheckBox1.CheckedChanged
        CType(TChart1.Tools(0), Steema.TeeChart.ColorBand).DrawBehind = Not CType(TChart1.Tools(0), Steema.TeeChart.ColorBand).DrawBehind
End Sub
Color Line Tool
The Color Line Tool adds colored lines to the Chart which can be set vertically or horizontally in line with the axis values. Design-time

ColorLines can be associated with a specific Axis at a specific series Value. Border (Pen Editor) allows you to configure the style, colour, width, ending, transparency and visibility of the pen, Allow Drag enables dragging, Drag Repaint repaints the Chart while the ColorLine Tool is being dragged, No Drag Limit allows the ColorLine to be dragged beyond the Chart's Axes, Draw Behind draws the ColorLine behind the Chart Series while Draw3D draws the ColorLine in 3D.
Run-time
Adding an Color Line Tool at runtime is a straightforward operation, as can be seen in the example below:
[C#]
Bar bar1 = new Bar(tChart1.Chart);
ColorLine colorLine1 = new ColorLine(tChart1.Chart);

bar1.FillSampleValues(20);
colorLine1.Active = true;
colorLine1.AllowDrag = true;
colorLine1.Axis = tChart1.Axes.Left;
colorLine1.Pen.Color = Color.Blue;
colorLine1.Value = bar1.YValues.Maximum / 2;

[VB.Net]
Dim Bar1 As New Steema.TeeChart.Styles.Bar(TChart1.Chart)
Dim ColorLine1 As New Steema.TeeChart.ColorLine(TChart1.Chart)

Bar1.FillSampleValues(20)
ColorLine1.Active = True
ColorLine1.AllowDrag = True
ColorLine1.Axis = TChart1.Axes.Left
ColorLine1.Pen.Color = Color.Blue
ColorLine1.Value = Bar1.YValues.Maximum / 2
Grid Band Tool
The Grid Band Tool displays colored rectangles (bands) at the grid lines of the specified axis and position.
Design-time

Use the Axis combobox to select the axis you wish to associate with the tool. The bush and color characteristics of each band can be specified using the Band and Color buttons respectively.

Run-time
Adding an Grid Band Tool at runtime is a straightforward operation, as can be seen in the example below:
[C#]
GridBand tool = new GridBand(tChart1.Chart);[VB.Net]
Line line = new Line(tChart1.Chart);
line.FillSampleValues();
tool.Axis = tChart1.Axes.Left;
tool.Band1.Color = Color.Red;
tool.Band2.Color = Color.White;
Dim tool As GridBand = New GridBand(TChart1.Chart)
Dim line As Line = New Line(TChart1.Chart)
line.FillSampleValues()

tool.Axis = TChart1.Axes.Left
tool.Band1.Color = Color.Red
tool.Band2.Color = Color.White
Axis Scroll Tool
The Axis Scroll Tool allows the scrolling of Axes by mouse dragging.
Design-time

Use the Axis combobox to select the axis you wish to associate with the tool.

Run-time
Adding an Axis Scroll Tool at runtime is a straightforward operation, as can be seen in the example below:
[C#]
AxisScroll tool = new AxisScroll(tChart1.Chart);
Line line = new Line(tChart1.Chart);
line.FillSampleValues();
tool.Axis = tChart1.Axes.Left;
[VB.Net]
Dim tool As AxisScroll = New AxisScroll(tChart1.Chart)
Dim line As Line = New Line(tChart1.Chart)
line.FillSampleValues()
tool.Axis = tChart1.Axes.Left
Cursor Tool
The Cursor Tool adds cursors to the Chart which can be associated with individual series or with the Chart as a whole. Cursors may be horizontal, vertical or both (crosshair). Design-time

Once added, Cursor tools may or may not be associated with a Chart Series and may be configured in Style as being horizontal, vertical or both. If a Cursor Tool is associated with a series then it can be set to Snap to the series YValues as the cursor is moved. Follow Mouse causes the Cursor Tool to move with the mouse while Pen (Pen Editor) allows you to configure the style, colour, width, ending, transparency and visibility of the Cursor Tool.
Run-time
Adding a Cursor Tool at runtime is a straightforward operation, as can be seen in the example below:
[C#]
Points pointSeries1 = new Points(tChart1.Chart);
CursorTool cursorTool1 = new CursorTool(tChart1.Chart);

pointSeries1.FillSampleValues(20);
cursorTool1.Active = true;
cursorTool1.FollowMouse = true;
cursorTool1.Series = pointSeries1;
cursorTool1.Style = CursorToolStyles.Both;

[VB.Net]
Dim PointSeries1 As New Steema.TeeChart.Styles.Points(TChart1.Chart)
Dim CursorTool1 As New Steema.TeeChart.Tools.CursorTool(TChart1.Chart)

PointSeries1.FillSampleValues(20)
CursorTool1.Active = True
CursorTool1.FollowMouse = True
CursorTool1.Series = PointSeries1
CursorTool1.Style = Steema.TeeChart.Tools.CursorToolStyles.Both
Drag Marks Tool
The Drag Marks Tool allows the mousedrag of Marks for the selected Series. Design-time

The Drag Marks Tool can be set to a specific Series or call be left associated with all Chart series. Reset Positions returns all moved marks back to their original default positions.
Run-time
Adding a Drag Marks Tool at runtime is a straightforward operation, as can be seen in the example below:
[C#]
Bar bar1 = new Bar(tChart1.Chart);
DragMarks dragMarks1 = new DragMarks(tChart1.Chart);

bar1.FillSampleValues(20);
dragMarks1.Active = true;
dragMarks1.Series = bar1;

[VB.Net]
Dim Bar1 As New Steema.TeeChart.Styles.Bar(TChart1.Chart)
Dim DragMarks1 As New Steema.TeeChart.DragMarks(TChart1.Chart)

Bar1.FillSampleValues(20)
DragMarks1.Active = True
DragMarks1.Series = Bar1
Drag Point Tool
The Drag Point Tool allows the mousedrag of Series Points for the selected Series. Design-time

The Drag Point Tool can be set to a specific Series or call be left associated with all Chart series. Style enables the Drag Point Tool to either drag the points in the X orientation, the Y orientation or in both orientations, Mouse Button selects the active mouse button while Cursor selects the style of cursor shown when dragged over a Series point.
Run-time
Adding a Drag Point Tool at runtime is a straightforward operation, as can be seen in the example below:
[C#]
Bar bar1 = new Bar(tChart1.Chart);
DragPoint dragPoint1 = new DragPoint(tChart1.Chart);

bar1.FillSampleValues(10);
dragPoint1.Active = true;
dragPoint1.Series = bar1;
dragPoint1.Style = DragPointStyles.Y;

 [VB.Net]
Dim Bar1 As New Steema.TeeChart.Styles.Bar(TChart1.Chart)
Dim DragPoint1 As New Steema.TeeChart.DragPoint(TChart1.Chart)

Bar1.FillSampleValues(10)
DragPoint1.Active = True
DragPoint1.Series = Bar1
DragPoint1.Style = Steema.TeeChart.DragPointStyles.Y
Draw Line Tool
The Draw Line Tool enables fully customisable lines to be drawn, selected, dragged and deleted on the Chart with the mouse. Design-time

The Draw Line Tool can be set to a specific Series or can be left associated with none of the Chart series via the Series ComboBox. The Button ComboBox sets the Draw Line Tool to a specific mouse button. Pen (Pen Editor) allows you to configure the style, colour, width, ending, transparency and visibility of the Draw Lines while Enable Drawing and Enable Select respectively enable/disable the drawing and selection of the Lines.
Run-time
Adding a Draw Line Tool at runtime is a straightforward operation, as can be seen in the example below:
[C#]
Bar bar1 = new Bar(tChart1.Chart);
DrawLine drawLine1 = new DrawLine(tChart1.Chart);

bar1.FillSampleValues(20);
drawLine1.Series = bar1;
drawLine1.Button = MouseButtons.Left;
drawLine1.EnableDraw = true;
drawLine1.EnableSelect = true;
drawLine1.Pen.Color = Color.AliceBlue;

[VB.Net]
Dim Bar1 As New Steema.TeeChart.Styles.Bar(TChart1.Chart)
Dim DrawLine1 As New Steema.TeeChart.DrawLine(TChart1.Chart)

Bar1.FillSampleValues(20)
DrawLine1.Series = Bar1
DrawLine1.Button = MouseButtons.Left
DrawLine1.EnableDraw = True
DrawLine1.EnableSelect = True
DrawLine1.Pen.Color = Color.AliceBlue
Gantt Drag Tool
The Gantt Drag tool drags and resizes the bars of a Gantt Series. Design-time

The Gantt Drag Tool has to be associated with a specific Gantt Series. Resize Pixel Tolerance specifies the accuracy of dragging in pixels, Allow Drag enables dragging while Cursor specifies the cursor displayed while dragging. Allow Resize enables Gantt Bar resizing while Cursor specifies the cursor displayed while resizing.
Run-time
Adding an Image Tool at runtime is a straightforward operation, as can be seen in the example below:
[C#]
GanttSeries ganttSeries1 = new GanttSeries(tChart1.Chart);
GanttTool ganttTool1 = new GanttTool(tChart1.Chart);

ganttSeries1.FillSampleValues(10);
ganttTool1.AllowResize = false;
ganttTool1.AllowDrag = true;
ganttTool1.MinPixels = 3;
ganttTool1.Series = ganttSeries1;
ganttTool1.Active = true;

tChart1.Legend.Visible = false;

[VB.Net]
Dim GanttSeries1 As New Steema.TeeChart.GanttSeries(TChart1.Chart)
Dim GanttTool1 As New Steema.TeeChart.GanttTool(TChart1.Chart)

GanttSeries1.FillSampleValues(10)
GanttTool1.AllowResize = False
GanttTool1.AllowDrag = True
GanttTool1.MinPixels = 3
GanttTool1.Series = GanttSeries1
GanttTool1.Active = True

TChart1.Legend.Visible = False
Image Tool
The Image Tool draws a picture (bitmap, jpeg, gif, png, pcx) behind a specified chart Series. Design-time

The Image Tool can be associated with a specific Series or can be left at default associated with none of the Chart series. Using Image one can browse for or clear images of all formats.
Run-time
Adding an Image Tool at runtime is a straightforward operation, as can be seen in the example below:
[C#]
Bar bar1 = new Bar(tChart1.Chart);
ChartImage chartImage1 = new ChartImage(tChart1.Chart);
string imagePath = @"C:.bmp";
Bitmap myBitMap = new Bitmap(imagePath);

bar1.FillSampleValues(20);
chartImage1.Active = true;
chartImage1.Image = myBitMap;

[VB.Net]
Dim Bar1 As New Steema.TeeChart.Styles.Bar(TChart1.Chart)
Dim ChartImage1 As New Steema.TeeChart.ChartImage(TChart1.Chart)
Dim ImagePath As String = "C:.bmp"
Dim MyBitMap As New Bitmap(ImagePath)

Bar1.FillSampleValues(20)
ChartImage1.Active = True
ChartImage1.Image = MyBitMap
Mark Tips Tool
The Marks Tip tool is used to display default Hint windows when the mouse is over (or clicks) a Series point. Design-time

The Mark Tips Tool can be associated with a specific Series or can be left at default associated with none of the Chart series. Style defines the type of series data to be displayed in the Mark Tips while Mouse Action sets whether the Mark Tips appear on a Mouse click or move. Delay defines the lapse of time in milliseconds before the Mark Tips appear.
Run-time
Adding a Mark Tips Tool at runtime is a straightforward operation, as can be seen in the example below:
[C#]
PointSeries pointSeries1 = new PointSeries(tChart1.Chart);
MarksTip marksTip1 = new MarksTip(tChart1.Chart);
        tab
pointSeries1.FillSampleValues(20);
marksTip1.Active = true;
marksTip1.MouseDelay = 500;
marksTip1.MouseAction = MarksTipMouseAction.Move;
marksTip1.Style = MarksStyles.XY;

[VB.Net]
Dim PointSeries1 As New Steema.TeeChart.PointSeries(TChart1.Chart)
Dim MarksTip1 As New Steema.TeeChart.MarksTip(TChart1.Chart)

PointSeries1.FillSampleValues(20)
MarksTip1.Active = True
MarksTip1.MouseDelay = 500
 MarksTip1.MouseAction = Steema.TeeChart.MarksTipMouseAction.Move
 MarksTip1.Style = Steema.TeeChart.MarksStyles.XY
Nearest Point Tool
The Nearest Point Tool moves a marker to the point nearest to the cursor. The tool may be associated with a Series or applied globally to the Chart. Design-time

The Nearest Point Tool needs to be associated with a specific Chart Series. Its appearance can be configured using Fill (Hatch Brush Editor) to define the body of the Nearest Point Tool, it's colour, transparency, visibility, fill-style, fill-gradient or fill-image and Border (Pen Editor) to define the style, colour, width, ending, transparency and visibility of the Nearest Point Tool's border pen . Draw Line enables/disables the drawing of the connecting line between the cursor position and the Nearest Point Tool shape, Size defines the size of this shape while Style defines the type of shape used.
Run-time
Adding a Nearest Point Tool at runtime is a straightforward operation, as can be seen in the example below:
[C#]
Line line1 = new Line(tChart1.Chart);
NearestPoint nearestPoint1 = new NearestPoint(tChart1.Chart);

line1.FillSampleValues(20);
nearestPoint1.Series = line1;
nearestPoint1.Pen.Color = Color.Blue;
nearestPoint1.Size = 25;
nearestPoint1.Style = NearestPointStyles.Diamond;

[VB.Net]
Dim Line1 As New Steema.TeeChart.Styles.Line(TChart1.Chart)
Dim NearestPoint1 As New Steema.TeeChart.NearestPoint(TChart1.Chart)

Line1.FillSampleValues(20)
NearestPoint1.Series = Line1
NearestPoint1.Pen.Color = Color.Blue
NearestPoint1.Size = 25
NearestPoint1.Style = Steema.TeeChart.NearestPointStyles.Diamond
Page Number Tool
The Page Number Tool displays a fully configurable text box containing a chosen page numbering system. Design-time

The Text of the Page Number Tool and the box it sits in can both be fully configured. The Options tab allows you to enter the text you wish and to specify its position either by default or custom values. The Format tab configures the text box, allowing you to change its colour (Color Editor), frame (Pen Editor), pattern (HatchBrush Editor), roundness and transparency. The Text tab enables the setting of the text font (Font Editor), fill (Hatch Brush Editor) and also the colour (Color Editor) and pattern (HatchBrush Editor) of the text shadow. The Gradient tab configures the properties of the text-box gradient, the Shadow tab configures the properties of the text-box shadow while the Bevels tab configures the properties of the text-box bevels.
Run-time
Adding a Page Number Tool at runtime is a straightforward operation, as can be seen in the example below:
[C#]
private void Form1_Load(object sender, System.EventArgs e)
        Bar bar1 = new Bar(tChart1.Chart);
        PageNumber pageNumber1 = new PageNumber(tChart1.Chart);

        bar1.FillSampleValues(200);
        tChart1.Page.MaxPointsPerPage = 10;


private void button1_Click(object sender, System.EventArgs e)
        tChart1.Page.Previous();


private void button2_Click(object sender, System.EventArgs e)
        tChart1.Page.Next();


[VB.Net]
Private Sub Form1_Load(ByVal sender As System.Object, ByVal e As System.EventArgs) Handles MyBase.Load
        Dim Bar1 As New Steema.TeeChart.Styles.Bar(TChart1.Chart)
        Dim PageNumber1 As New Steema.TeeChart.PageNumber(TChart1.Chart)

        Bar1.FillSampleValues(200)
        TChart1.Page.MaxPointsPerPage = 10
End Sub

Private Sub Button1_Click(ByVal sender As System.Object, ByVal e As System.EventArgs) Handles Button1.Click
        TChart1.Page.Previous()
End Sub

Private Sub Button2_Click(ByVal sender As System.Object, ByVal e As System.EventArgs) Handles Button2.Click
        TChart1.Page.Next()
End Sub
Pie Slices Tool
The Pie SlicesTool highlights the pie slice under the mouse either by drawing a border around it or by exploding it away from the rest of the Pie Series. Design-time

The Pie Slices Tool has to be associated with a specific Pie Series. Style specifies whether the Pie Slice is highlighted by a border around it (which can be edited by the Border button (Pen Editor)) or by exploding it away from the rest of the Pie Series.
Run-time
Adding a Rotate Tool at runtime is a straightforward operation, as can be seen in the example below:
[C#]
PieSeries pieSeries1 = new PieSeries(tChart1.Chart);
PieTool pieTool1 = new PieTool(tChart1.Chart);

pieSeries1.FillSampleValues(10);
pieTool1.Series = pieSeries1;
pieTool1.Style = PieToolStyle.Explode;

[VB.Net]
Dim PieSeries1 As New Steema.TeeChart.PieSeries(TChart1.Chart)
Dim PieTool1 As New Steema.TeeChart.PieTool(TChart1.Chart)

PieSeries1.FillSampleValues(10)
PieTool1.Series = PieSeries1
PieTool1.Style = Steema.TeeChart.PieToolStyle.Explode
Rotate Tool
The Rotate tool changes the elevation and rotation of charts when dragging the mouse over a chart. Design-time

The Rotate Tool can be configured, using the the Style ComboBox, to rotate (turn the chart aound a vertical axis), elevate (turn the chart around a horizonatal axis) or to perform both actions at once. The Mouse Button used to rotate the chart can also be selected.
Run-time
Adding a Rotate Tool at runtime is a straightforward operation, as can be seen in the example below:
[C#]
Line line1 = new Line(tChart1.Chart);
Rotate rotate1 = new Rotate(tChart1.Chart);

line1.FillSampleValues(20);
rotate1.Button = MouseButtons.Right;
rotate1.Style = RotateStyles.Elevation;

[VB.Net]
Dim Line1 As New Steema.TeeChart.Styles.Line(TChart1.Chart)
Dim Rotate1 As New Steema.TeeChart.Rotate(TChart1.Chart)

Line1.FillSampleValues(20)
Rotate1.Button = MouseButtons.Right
Rotate1.Style = Steema.TeeChart.RotateStyles.Elevation
Series Animation Tool
The Series Animation Tool performs a growing animation of Series Points.
Design-time

The Series Animation tool has to be associated with a series for it to function. The speed of the animation is controlled by the steps trackbar and the draw every property while the start point of the animation is defined either by the series minimum value or by the start value textbox.

Run-time
Adding an Series Animation at runtime is a straightforward operation, as can be seen in the example below:
[C#]
private SeriesAnimation tool;
private void InitializeChart()

     Bar bar = new Bar(tChart1.Chart);
     tool = new SeriesAnimation(tChart1.Chart);
     tool.Series = bar;
     bar.FillSampleValues();


private void button1_Click(object sender, EventArgs e)

     tool.Execute();
[VB.Net]
Dim tool As SeriesAnimation

Public Sub InitializeChart()
 Dim bar As Bar = New Bar(TChart1.Chart)
 tool = New SeriesAnimation(TChart1.Chart)
 tool.Series = bar
 bar.FillSampleValues()
End Sub

Private Sub Button1_Click(ByVal sender As System.Object, ByVal e As System.EventArgs) Handles Button1.Click
 tool.Execute()
End Sub
Extra Legend Tool
The Extra Legend tool displays a custom legend at any location inside the Chart.
Design-time

The Extra Legend tool has to be associated with a series for it to appear. The "Edit Legend" dialog allows the legend to be fully configured.
Run-time
Adding an Extra Tool at runtime is a straightforward operation, as can be seen in the example below:
[C#]
Bar bar = new Bar(tChart1.Chart);
ExtraLegend tool = new ExtraLegend(tChart1.Chart);
tool.Series = bar;
bar.FillSampleValues();
[VB.Net]
Dim bar As Bar = New Bar(TChart1.Chart)
Dim tool As ExtraLegend = New ExtraLegend(TChart1.Chart)
tool.Series = bar
bar.FillSampleValues()
Surface Nearest Tool
The Surface Nearest tool displays a custom legend at any location inside the Chart.
Design-time

Use the Series combobox to select the surface series you wish to associate with the tool. The cell, row and column color characteristics can be edited by using the relevant color editor.

Run-time
Adding an Surface Nearest tool at runtime is a straightforward operation, as can be seen in the example below:
[C#]
Surface surface = new Surface(tChart1.Chart);
SurfaceNearestTool tool = new SurfaceNearestTool(tChart1.Chart);
tool.Series = surface;
surface.FillSampleValues();
[VB.Net]
Dim surface As Surface = New Surface(TChart1.Chart)
Dim tool As SurfaceNearestTool = New SurfaceNearestTool(TChart1.Chart)
tool.Series = surface
surface.FillSampleValues()
Fibonacci Tool
The Fibonacci tool Fibonacci arcs or fans based on a specific trendline.
Design-time

Use the Series combobox to select the series you wish to associate with the tool. Both the Fibonacci's drawing characteristics as well as it's algorithmic variables can be fully configured in the above editor.

Run-time
Adding an Fibonacci Tool at runtime is a straightforward operation, as can be seen in the example below:
[C#]
Candle candle = new Candle(tChart1.Chart);
FibonacciTool tool = new FibonacciTool(tChart1.Chart);
candle.FillSampleValues();
tool.Series = candle;
tool.StartX = candle.DateValues[0];
tool.StartY = candle.CloseValues[0];
tool.EndX = candle.DateValues[10];
tool.EndY = candle.CloseValues[10];
[VB.Net]
Dim candle As Candle = New Candle(tChart1.Chart)
Dim tool As FibonacciTool = New FibonacciTool(tChart1.Chart)
candle.FillSampleValues
tool.Series = candle
tool.StartX = candle.DateValues(0)
tool.StartY = candle.CloseValues(0)
tool.EndX = candle.DateValues(10)
tool.EndY = candle.CloseValues(10)
Series Region Tool
The Series Region tool paints an area underneath a series of points or lines.
Design-time

Use the Series combobox to select the series you wish to associate with the tool. The Origin specifies the yvalue (horizontal) base value of the area while the Bounds specify the xvalue (vertical) start and end point limits. Use the format tab to define area pen and brush characteristics.

Run-time
Adding an Series Region Tool at runtime is a straightforward operation, as can be seen in the example below:
[C#]
Line line = new Line(tChart1.Chart);
SeriesRegionTool tool = new SeriesRegionTool(tChart1.Chart);
line.FillSampleValues();
tool.Series = line;
[VB.Net]
Dim line As Line = New Line(TChart1.Chart)
Dim tool As SeriesRegionTool = New SeriesRegionTool(TChart1.Chart)
tool.Series = line
line.FillSampleValues()
Legend Palette Tool
The Legend Palette tool displays a custom legend made with 3D series palette color.
Design-time

Use the Series combobox to select the 3D series you wish to associate with the tool. All elements of this tool are fully configurable.

Run-time
Adding an Legend Palette Tool at runtime is a straightforward operation, as can be seen in the example below:
[C#]
Surface surface = new Surface(tChart1.Chart);
LegendPalette tool = new LegendPalette(tChart1.Chart);
surface.FillSampleValues();
tool.Series = surface;
[VB.Net]
Dim surface As Surface = New Surface(TChart1.Chart)
Dim tool As LegendPalette = New LegendPalette(TChart1.Chart)
surface.FillSampleValues()
tool.Series = surface
Series Statistics Tool
The Series Statistics Tool calculates a number of standard statistical measures for a given series.
Design-time

Use the Series combobox to select the series you wish to associate with the tool.

Run-time
Adding an Series Statistics Tool at runtime is a straightforward operation, as can be seen in the example below:
[C#]
SeriesStats tool = new SeriesStats(tChart1.Chart);
Line line = new Line(tChart1.Chart);
line.FillSampleValues();
tool.Series = line;

Annotation at = new Annotation(tChart1.Chart);
at.Shape.Transparency = 10;
at.Left = 80;
at.Top = 50;
at.Text = tool.Statistics;
[VB.Net]
Dim line As Line = New Line(TChart1.Chart)
Dim tool As SeriesStats = New SeriesStats(TChart1.Chart)
line.FillSampleValues()
tool.Series = line

Dim at As Annotation = New Annotation(TChart1.Chart)
at.Shape.Transparency = 10
at.Left = 80
at.Top = 50
at.Text = tool.Statistics
Clip Series Tool
The Clip Series Tool restricts series painting to within the bounderies of the axes to which it is associated. This is particularly useful when working with custom axes.
Design-time

Use the Series combobox to select the series you wish to associate with the tool.

Run-time
Adding an Series Statistics Tool at runtime is a straightforward operation, as can be seen in the example below:
[C#]
Axis vert = new Axis(false, false, tChart1.Chart);
Axis horiz = new Axis(true, false, tChart1.Chart);
tChart1.Axes.Custom.Add(vert);
tChart1.Axes.Custom.Add(horiz);

Line line = new Line(tChart1.Chart);
line.FillSampleValues();
horiz.StartPosition = 20;
horiz.EndPosition = 80;
vert.StartPosition = 20;
vert.EndPosition = 80;
line.CustomHorizAxis = horiz;
line.CustomVertAxis = vert;

ClipSeries tool = new ClipSeries(tChart1.Chart);
tool.Series = line;

tChart1.Panel.MarginBottom = 10;
tChart1.Panel.MarginLeft = 10;
[VB.Net]
Dim vert As Axis = New Axis(False, False, TChart1.Chart)
Dim horiz As Axis = New Axis(True, False, TChart1.Chart)
TChart1.Axes.Custom.Add(vert)
TChart1.Axes.Custom.Add(horiz)

Dim line As Line = New Line(TChart1.Chart)
line.FillSampleValues()
horiz.StartPosition = 20
horiz.EndPosition = 80
vert.StartPosition = 20
vert.EndPosition = 80
line.CustomHorizAxis = horiz
line.CustomVertAxis = vert

Dim tool As ClipSeries = New ClipSeries(TChart1.Chart)
tool.Series = line

TChart1.Panel.MarginBottom = 10
TChart1.Panel.MarginLeft = 10
Legend ScrollBar Tool
The Legend ScrollBar Tool allows the scrolling of Axes by mouse dragging.
Design-time

The various buttons within the Legend ScrollBar editor enable the different aspects of the tool to be fully configured graphically while the initial delay sets the amount of time between a click on the tool and the chart repaint.

Run-time
Adding an Legend ScrollBar Tool at runtime is a straightforward operation, as can be seen in the example below:
[C#]
Line line = new Line(tChart1.Chart);
LegendScrollBar tool = new LegendScrollBar(tChart1.Chart);
line.FillSampleValues();
[VB.Net]
Dim line As Line = New Line(TChart1.Chart)
Dim tool As LegendScrollBar = New LegendScrollBar(TChart1.Chart)
line.FillSampleValues()
2D Lighting Tool
The 2D Lighting Tool displays a 2 dimensional "light" effect over the chart Canvas.
Design-time

The position of the light tool (left and top) can be specified or you can chose to have the tool follow the mouse.

Run-time
Adding an 2D Lighting Tool at runtime is a straightforward operation, as can be seen in the example below:
[C#]
Line line = new Line(tChart1.Chart);
LightTool tool = new LightTool(tChart1.Chart);
tool.FollowMouse = true; //slow in Debug build
line.FillSampleValues();
[VB.Net]
Dim line As Line =  New Line(TChart1.Chart)
Dim tool As LightTool =  New LightTool(TChart1.Chart)
tool.FollowMouse = True 'slow in Debug build
line.FillSampleValues()
SubChart Tool
The SubChart Tool allows multiple Charts inside a single Chart.
Design-time

SubCharts are added to the chart using the Add button and are configured using the nested chart editor.

Run-time
Adding an SubChart Tool at runtime is a straightforward operation, as can be seen in the example below:
[C#]
Line line = new Line(tChart1.Chart);
SubChartTool tool = new SubChartTool(tChart1.Chart);
line.FillSampleValues();
TChart chart1 = tool.Charts.AddChart("Chart1");
chart1.Series.Add(typeof(Bar));
chart1[0].FillSampleValues();
[VB.Net]
Dim line As Line = New Line(TChart1.Chart)
Dim tool As SubChartTool = New SubChartTool(TChart1.Chart)
line.FillSampleValues()
Dim chart1 As TChart = tool.Charts.AddChart("Chart1")
chart1.Series.Add(GetType(Bar))
chart1(0).FillSampleValues()
Fader Tool
The Fader Tool effectuates a fade-in or fade-out Chart animation.
Design-time

Use the Fader Tool editor to set the speed, "empty" color, style and initial delay of the animation.

Run-time
Adding an Fader Tool at runtime is a straightforward operation, as can be seen in the example below:
[C#]
private FaderTool tool;
private void InitializeChart()

     Line line = new Line(tChart1.Chart);
     tool = new FaderTool(tChart1.Chart);
     tool.Color = Color.Yellow;
     line.FillSampleValues();


private void button1_Click(object sender, EventArgs e)

     tool.Start();
[VB.Net]
Private tool As FaderTool
Private  Sub InitializeChart()
     Dim line As Line =  New Line(TChart1.Chart)
     tool = New FaderTool(TChart1.Chart)
     tool.Color = Color.Yellow
     line.FillSampleValues()
End Sub

Private Sub Button1_Click(ByVal sender As System.Object, ByVal e As System.EventArgs) Handles Button1.Click
     tool.Start()
End Sub
Rectangle Tool
The Rectangle Tool is an Annotation tool that can be dragged and resized.
Design-time

The editor provides for the full configuration of text and its bounding area.

Run-time
Adding an Rectangle Tool at runtime is a straightforward operation, as can be seen in the example below:
[C#]
Line line = new Line(tChart1.Chart);
RectangleTool tool = new RectangleTool(tChart1.Chart);
line.FillSampleValues();
tool.Text = "Text";
[VB.Net]
Dim line As Line =  New Line(TChart1.Chart)
Dim tool As RectangleTool =  New RectangleTool(TChart1.Chart)
line.FillSampleValues()
tool.Text = "Text"
Selector Tool
The Selector Tool enables the end-user to click and drag chart elements like series, axes, legend, titles, etc..
Design-time

The Selector Tool editor enables you to configure the size and brush characteristics of the handles that represent a selected object, as well as whether draggable objects (e.g. legend) can be dragged or not. The cursor style displayed when the tool is active can also be defined.

Run-time
Adding an Selector Tool at runtime is a straightforward operation, as can be seen in the example below:
[C#]
Bar bar = new Bar(tChart1.Chart);
Selector tool = new Selector(tChart1.Chart);
bar.FillSampleValues();
tool.Cursor = Cursors.IBeam;
[VB.Net]
Dim bar As Bar =  New Bar(TChart1.Chart)
Dim tool As Selector =  New Selector(TChart1.Chart)
bar.FillSampleValues()
tool.Cursor = Cursors.IBeam
Transpose Series Tool
The Transpose Series Tool swaps multiple series rows and columns.
Design-time
Click on the Transpose button to perform the operation.
Run-time
Adding an Transpose Series Tool at runtime is a straightforward operation, as can be seen in the example below:
[C#]
private SeriesTranspose tool;
private void InitializeChart()

     Bar bar = new Bar(tChart1.Chart);
     bar.MultiBar = MultiBars.None;
     tool = new SeriesTranspose(tChart1.Chart);
     bar.FillSampleValues();


private void button1_Click(object sender, EventArgs e)

     tool.Transpose();
[VB.Net]
Private tool As SeriesTranspose
Private  Sub InitializeChart()
     Dim bar As Bar =  New Bar(tChart1.Chart)
     bar.MultiBar = MultiBars.None
     tool = New SeriesTranspose(tChart1.Chart)
     bar.FillSampleValues()
End Sub

Private Sub Button1_Click(ByVal sender As System.Object, ByVal e As System.EventArgs) Handles Button1.Click
     tool.Transpose()
End Sub
Data Table Tool
The Data Table Tool displays an Excel-like table besides vertical or horizontal axes.
Design-time

Use the Data Table editor to configure the table's borders (rows and columns), position and text format.

Run-time
Adding an Data Table Tool at runtime is a straightforward operation, as can be seen in the example below:
[C#]
Bar bar = new Bar(tChart1.Chart);
DataTableTool tool = new DataTableTool(tChart1.Chart);
bar.FillSampleValues();
[VB.Net]
Dim bar As Bar =  New Bar(TChart1.Chart)
Dim tool As DataTableTool =  New DataTableTool(TChart1.Chart)
bar.FillSampleValues()
Banner Tool
The Banner Tool produces a scrolling and blinking text animation.
Design-time

Use the Banner Tool editor to configure the tool's text and bounding box.

Run-time
Adding an Banner Tool at runtime is a straightforward operation, as can be seen in the example below:
[C#]
Bar bar = new Bar(tChart1.Chart);
BannerTool tool = new BannerTool(tChart1.Chart);
bar.FillSampleValues();
tool.Text = "Text";
[VB.Net]
Dim bar As Bar =  New Bar(TChart1.Chart)
Dim tool As BannerTool =  New BannerTool(TChart1.Chart)
bar.FillSampleValues()
tool.Text = "Text"
Magnify Tool
The Magnify Tool magnifies a portion of the chart.
Design-time

Use the Magnify Tool to fully configure its graphical and functional characteristics.

Run-time
Adding an Magnify Tool at runtime is a straightforward operation, as can be seen in the example below:
[C#]
Bar bar = new Bar(tChart1.Chart);
Magnify tool = new Magnify(tChart1.Chart);
bar.FillSampleValues();
[VB.Net]
Dim bar As Bar =  New Bar(TChart1.Chart)
Dim tool As Magnify =  New Magnify(TChart1.Chart)
bar.FillSampleValues()