Tutorial 9 - TeeChart and WebChart and ASP.NET
WebForms Adding a Chart to a Form
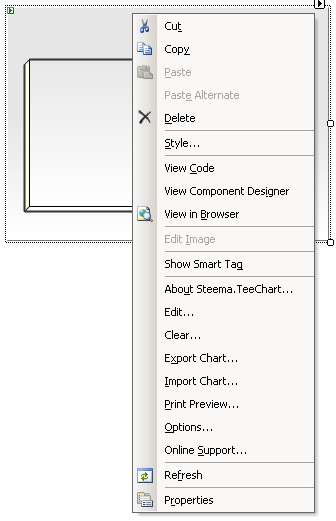
Designing with the Chart Editor and property options
Image formats (PictureFormat property)
TempChart property - File, Session, Cache or Httphandler
Using Interactive Chart events (AutoPostback property)
Event example
Security issues
Free scripted ASP applications
Adding the Chart to a script
Process flow
Coding with TeeChart
Key code elements for Chart retrieval
Adding events
WebChart Tools
HotspotTool
ScrollTool
ZoomTool
Window onload event
WebForms
TeeChart is integrated for WebForms via the WebChart TeeChart Control. WebChart may be found in the ToolBox in a standard TeeChart.NET installation. WebChart icon in Toolbox
Adding a Chart to a Form
Designing with the Chart Editor and property options
The Chart Editor offers options to cnfigure most aspects of the Chart for runtime. Settings are saved in the WebForm. Please see Tutorials 1 and 2 for general use of the Chart Editor, use of the Editor for the WebChart is the same in all respects as its use for a Windows Form based Chart.

Image formats (PictureFormat)
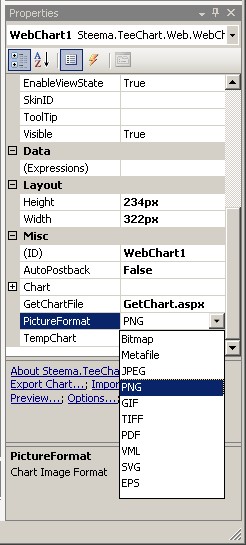
The WebChart renders on the WebForm as an image, the default format is PNG but may be changed via the PictureFormat property in the Properties Windows. For compatibility with Web pages we recommend use of PNG, JPEG or GIF formats though Bitmap is also supported under Internet Explorer browsers.
Use of GIF image formatGIF uses a 256 colour reduction so for full colour reproduction we recommend that you use one of the other image formats.
*Note Please be aware that your use of GIF image format may be subject to license
See Unisys and LZW for more information on use of GIF LZW encoded images.

TempChart property - File, Session, Cache or Httphandler
The TempChart property may be used to select how the temporary Chart should be stored after creation and before display on the browser page. There are 4 available settings:
Performance is similar for all caching techniques though disk performance may affect positively or negatively use of the 'File' option for generating the TempChart such that 'File' can be the quickest option.
File
The File setting should be used if you wish to write temporary files to disk. By default, when TeeChart is installed, it creates registry keys with the temporary file location and equivalent virtual folder name. The keys are as follows:
[HKEY_LOCAL_MACHINE\SOFTWARE\Steema Software\TeeChart.NET]
"VirtualShare"="/TeeChartForNET"
"ShareFolder"="C:\\Program Files\\Steema Software\\TeeChart for .NET v3\\TeeChartForNET"
The above settings are as would be created in a standard English Language machine if default install locations are accepted. The TeeChartNET virtual folder is created by the TeeChart installer. You may change these registry settings provided you create the necessary IIS Virtual Share location to reflect the new registry value.
WebChart saves files to a folder called _Chart_tmp below the folder named in the ShareFolder registry key.
Temporary files are not deleted by TeeChart though a utility may be included for you to do so automatically as a Windows scheduled task, please check TeeChart inclusions with the current version.
Session
Session is a setting for temporary file storage that leaves no file on disk and removes its own cached memory files (see also the Cache and Httphandler options). You may find it slightly slower than temporary disk files under some circumstances. Two conditions must be true for the Chart to successfully run with Session variables:
<sessionStateInProc is the default setting and signifies that Session is enabled for this application.
mode="InProc"
GetChart.aspx.cs
The script recovers the Chart that WebChart has previously saved to the Session cache. The script returns the Chart to the browser and removes it from the cache.
        private void Page_Load(object sender, System.EventArgs e)
        {
            string chartName=Request.QueryString["Chart"];

            if (Session[chartName]!=null)
            {
                System.IO.MemoryStream chartStream = new System.IO.MemoryStream();
                chartStream=((System.IO.MemoryStream)Session[chartName]);
                Response.ContentType = "image/" + "png";
                Response.OutputStream.Write(chartStream.ToArray(),0,(int)chartStream.Length);
                chartStream.Close();
                Session.Remove(chartName);
            }
        }
Cache
The Cache option is very similar in setup to the Session Chart caching option. 'Cache' is a practical option to use as it uses the Cache object that belongs to the ASP.NET WebForm page and as such is easily present for most ASP.NET application configurations whereas 'Session' is susceptible to administrative limitations on some Web Servers (ie. where administrators have chosen to disable Session support for security reasons).
The cache option requires the use of the GetChart.aspx file.
GetChart.aspx.cs
        private void Page_Load(object sender, System.EventArgs e)
        {
            string chartName=Request.QueryString["Chart"];

            if (Page.Cache[chartName]!=null)
            {
                MemoryStream chartStream = new MemoryStream();
                chartStream=((MemoryStream)Page.Cache[chartName]);
                Response.ContentType = "image/" + "png";
                Response.OutputStream.Write(chartStream.ToArray(),0,(int)chartStream.Length);
                chartStream.Close();
            }
        }
The script recovers the Chart that WebChart has previously saved to the Page Cache. The script returns the Chart to the browser and removes it from the cache.
Httphandler
The Httphandler option uses an internal TeeChart (WebChart) generator to recover the Chart image for the page. The option generates no temporary files and requires no additional aspx file to recover a Chart (as would be the case with the Session and Cache options). The option requires one modification to the web.config file:
Anywhere between the web.config <system.web> </system.web> tages place the following section:
<system.web>
  <httpHandlers>
       <add verb="*" path="TeeChartImgGen.ashx" type="Steema.TeeChart.Web.TeeChartImgGen, TeeChart"/>
  </httpHandlers>

/*..content cut for brevity ..*/

</system.web>
Using Interactive Chart events (AutoPostback property True when no WebChart Tools in Chart)
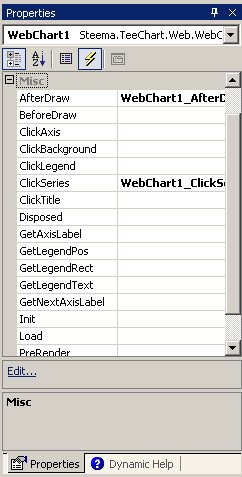
Load events and runtime interactive events that respond to user mouseclicks on the Chart may be used with TeeChart's WebChart. No special action needs to be taken to use a paint event such as 'AfterDraw', one can select the Chart event from the Property browser eventlist. If no TeeChart WebChart Tool such as Zoom, Scroll or Hotspot is present in the Chart you should set the AutoPostback property to True to enable interactive (user click) events. If the aforementioned Tools are present click response is automatically activated. For interactive events, the Chart will respond to user mouseclick events posting back the information of where the click has occurred to the server whereupon your serverside code can act upon the event. The event you wish to use may then be selected for coding from the property browser eventlist.
See the 'Event example' section for more information about WebChart events.
Event example
If you wish to use a Click event in your WebChart, such as ClickSeries, please be sure to set the Chart AutoPostback to true.
Events may be setup by double-clicking the required event in the Property browser Event list:

Double-clicking an entry in the list creates the in-code event declaration.
Example
        private int xVal;
        private int yVal;

        private void WebChart1_AfterDraw(object sender, Steema.TeeChart.Drawing.Graphics3D g)
        {
            g.TextOut(xVal,yVal,"onAfterDraw");
        }
The above event will output text to the Chart at a location decided by the xVal and yVal variable values.
The x and y values could be set according to the click location
        private void WebChart1_ClickSeries(object sender, Steema.TeeChart.Series s, int valueIndex, System.EventArgs e)
        {
            xVal=s.CalcXPos(valueIndex);
            yVal=s.CalcYPos(valueIndex);
        }
Free scripted ASP applications
An alternative to using WebChart in a WebForm is to use TeeChart as a scripted 'non-visible' control in a standard asp (aspx) page. TeeChart for .NET is shipped with a live example to demonstrate this technique. You can find it included with TeeChart's ASP.NET demo project, the example titled as 'Series Types as Image' under the 'Interacting with Charts\Chart as Image' demo folder
TeeChart may be free-scripted in ASP via the internal Chart class, though to take advantage of TeeChart events we recommend use of either the TChart Windows Forms Component or the WebChart Control
Adding the Chart to a script
Assuming the use of TChart, the initial steps yuo need to take to setup the TeeChart project are:
1. Create new ASP.NET Forms project. That creates a WebForm page that you will use as the client page. (See example SeriesTypes.aspx page)
2. Add new WebForm page. This page will be non visible and will be used to process Chart code serverside. (See example ShowSeries.aspx page)
- The page should include a Reference to System.Windows.Forms.dll. That is because the TChart component is a Windows.Forms based Component.
3. Follow the code steps highlighted here and in the ASPStreams example as a guide to how to setup your project.
Process flow
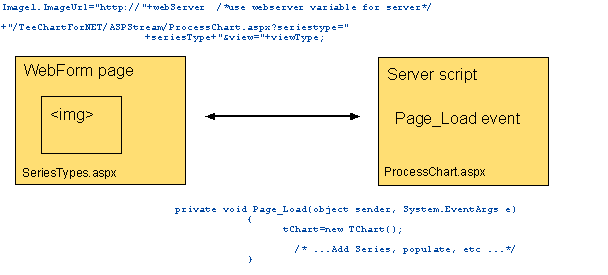
The client browser page (SeriesTypes.aspx) contains an image whose IMG link is the aspx server script (ShowSeries.aspx). A submit button on the client page calls the server script with the variables necessary to parameterise the processing of the serverChart. The button sends the variables as part of the parameters to set the imageURL of the client page Chart image, returning therefore, a dynamic Chart based on the processing parameters.

Coding with TeeChart
To code with TeeChart serverside add a using to TeeChart on the script page:
eg.
using Steema.TeeChart;
Then declare a variable for TChart and create it at the beginning of the Page_Load event
eg.
private TChart tChart;
private void Page_Load(object sender, System.EventArgs e)Key code elements for Chart retrieval
{
tChart=new TChart();
/* ...add Series and data, etc ... */
}
The key code components for Chart retrieval are:
1. The client 'Get' instruction. This may be initiated by a Submit button or other means such as a Combobox and 'gets' the Chart from the server based on client parameters. The request for a Chart may be sent as a 'traditional Get url line where the parameters are passed as one URL line or may be done via ASP.NET's "Passing Server Control Values Between Pages" (Please see Microsoft's help topic on this subject for more details). Coding for calling the server script will be made in the WebForms Code behind page.
Example
In this example variables are taken from different WrbForm page elements and added as parameters to the Image 'Get' url line.
        private void sendInfo()
        {
            seriesType=DropDownList1.Items[DropDownList1.SelectedIndex].ToString();
            viewType=CheckBox1.Checked.ToString();
            Image1.ImageUrl="http://"+webServer  /*use webserver variable for server*/
                +"/TeeChartForNET/ASPStream/ProcessChart.aspx?seriestype="
                +seriesType+"&view="+viewType;
        }
2. The server script receives the GET petition from the client and runs its Page_Load event. In the event the Chart may be created and the parameters recived may be used to define how the Chart is to be populated. The Chart is then rendered as an image and retirned as a stream to the client.
Example
        private void Page_Load(object sender, System.EventArgs e)
        {
            tChart=new TChart();
            tChart.AfterDraw += new Steema.TeeChart.TChart.PaintChartEventHandler(this.tChart_AfterDraw);

            /* ...add Series and data, etc ... */

            //Process Get parameters received from client
            if (Request.QueryString["view"]=="False")
                tChart.Aspect.View3D=false;
            else
                tChart.Aspect.View3D=true;

            MemoryStream tempStream = new MemoryStream();
            tChart.Export.Image.PNG.Save(tempStream);
            Response.ContentType="Image/PNG";
            Response.OutputStream.Write(tempStream.ToArray(),0,(int)tempStream.Length);
            tempStream.Close();
        }
Adding events
Chart creation events may be added for Free-scripted TeeChart ASP applications by adding events after Chart creation.
Example
        private void Page_Load(object sender, System.EventArgs e)
        {
            tChart=new TChart();
            tChart.AfterDraw += new Steema.TeeChart.TChart.PaintChartEventHandler(this.tChart_AfterDraw);

            /* ...add Series and data, etc ... */

            MemoryStream tempStream = new MemoryStream();
            tChart.Export.Image.PNG.Save(tempStream);
            Response.ContentType="Image/PNG";
            Response.OutputStream.Write(tempStream.ToArray(),0,(int)tempStream.Length);
            tempStream.Close();
        }

        private void tChart_AfterDraw(object sender, Steema.TeeChart.Drawing.Graphics3D g)
        {
            string tmpStr="Copyright My Organisation "+DateTime.Now.ToString();
            g.TextOut(g.Chart.Width-(int)g.TextWidth(tmpStr)-5,g.Chart.Height-(int)g.TextHeight("H")-3,tmpStr);
        }
The AfterDraw event code will be executed at Chart creation time and, in this case, the relevant message will be included on the Chart Canvas as the Chart is rendered to image. If you wish to use interactive events based on user mouseclicks on the client page Chart we recommend that you use the WebChart component on a WebForm.
Security issues
The default TeeChart for .NET installation via the Installer creates the folders and IIS virtual folders sufficient to access the ASP.NET examples included with TeeChart. The WebForm applications assume the activation of Session support in IIS to move temporary Chart information. The example projects may be modified in Visual Studio.NET to use 'File' as the medium to temporarily store Charts. In tests that works satisfactorily in Windows 2000. In Windows 2003 the additional security limitations installed by default limit the possibility to use the default '_chart_temp' folder (name and location of temp folder is configurable). In Win2003 servers security rights must be modified by the system administrator to permit the saving of temporary files to disk by the ASP.NET application in question.
WebChart Tools
WebChart Tools are available to add to a WebChart from the Editor Tools palette. Many non-WebChart specific tools may be used with WebCharts except for those that respond to mouse movement (except for the WebChart Tools themselves covered below). All the Tool techniques described below are included as live examples with the TeeChart WebChart demo.
HotspotTool
In its simplest form this tool activates a data point mouseover label, displayed as the mouse is passed over a point. The Hotspot Tool is also available for Winform Charts but the nature of operation differs for the WebChart as described here. The WebChart Hotspot Tool generates a mapregion associated with each data point. A Map Action may be selected from the following options:
- Mark - Shows a Point Mark according to the selected Style option.
- URL - Connects to a URL when a data point is clicked
- Script - Runs custom Javascript when a data point is clicked
Mark
Use the Style property to define Mark Style.
Eg. (via code)
Steema.TeeChart.Tools.SeriesHotspot hotspotTool =
         ((Steema.TeeChart.Tools.SeriesHotspot)WebChart1.Chart.Tools[0]);
hotspotTool.MapAction = Steema.TeeChart.Styles.MapAction.Mark;
hotspotTool.Style = Steema.TeeChart.Styles.MarksStyles.LabelPercentTotal;
URL
Use the GetHTMLMap event to set the URL called from a datapoint. The URL option may be set via the Editor but you must code the event to set the correct URL.
Eg.
//init code....
Steema.TeeChart.Tools.SeriesHotspot hotspotTool =
         ((Steema.TeeChart.Tools.SeriesHotspot)WebChart1.Chart.Tools[0]);

hotspotTool.GetHTMLMap += new Steema.TeeChart.Tools.SeriesHotspotEventHandler(hotspotTool_GetHTMLMap);

//event code:
private void hotspotTool_GetHTMLMap(Steema.TeeChart.Tools.SeriesHotspot sender, Steema.TeeChart.Tools.SeriesHotspotEventArgs e)
{
     if (CheckBox1.Checked)  //open new window?
        e.PointPolygon.Attributes="target='_blank'";
     else
        e.PointPolygon.Attributes="target='_self'";        tab

     if (e.Series==WebChart1.Chart.Series[0]) e.PointPolygon.HREF="http://" + TextBox1.Text; //set URL according to textbox text + TextBox1.Text; //set URL according to textbox text
     if (e.Series==WebChart1.Chart.Series[1]) e.PointPolygon.HREF="http://" + TextBox2.Text;
     if (e.Series==WebChart1.Chart.Series[2]) e.PointPolygon.HREF="http://" + TextBox3.Text; + TextBox3.Text;
     if (e.Series==WebChart1.Chart.Series[3]) e.PointPolygon.HREF="http://" + TextBox4.Text;
}
Script
The Script option may be used to process any custom content or value-add that you might wish to add to the Chart via Javascript. When Script is chosen as an option TeeChart adds the option to use a helper script, currently available: 'Annotation' (see Steema.TeeChart.Tools.HotspotHelperScripts). You may select not to use a Helperscript and define your own output.
Annotation Example:
protected void Page_Load(object sender, System.EventArgs e)
{

  //initialization

  Chart ch1 = WebChart1.Chart;

  Steema.TeeChart.Themes.ColorPalettes.ApplyPalette(ch1, 9);
  Steema.TeeChart.Tools.SeriesHotspot hotspot1 = new Steema.TeeChart.Tools.SeriesHotspot();
  ch1.Legend.Visible = false;
  ch1.Tools.Add(hotspot1);
  hotspot1.MapAction = Steema.TeeChart.Styles.MapAction.Script;

  hotspot1.GetHTMLMap += new Steema.TeeChart.Tools.SeriesHotspotEventHandler(hotspot1_GetHTMLMap);

  //....etc... more init code
}

private void hotspot1_GetHTMLMap(Steema.TeeChart.Tools.SeriesHotspot sender, Steema.TeeChart.Tools.SeriesHotspotEventArgs e)
{
     //This example calls a Bar Series but e.Series and e.PointPolygon.ValueIndex could be sent
     //as arguments for a drilldown query.

     //The prepared HelperScriptAnnotation text accepts your text as a variable for the Annotation
     //In the following case it calls an aspx script to generate and return a Chart as an image
     e.PointPolygon.Attributes=String.Format(Texts.HelperScriptAnnotation,
                            "<IMG SRC=ShowSeries.aspx?seriestype=Bar&view=False&width=100&height=80>");

     //The annotation could, alternatively, present text in the mouseover hint, eg.:
     //e.PointPolygon.Attributes=String.Format(Steema.TeeChart.Texts.HelperScriptAnnotation,"hello world.");
}
The HelperScriptAnnotation used in the example above is:
HelperScriptAnnotation ="onmouseover=\"ShowAnnotation('{0}');\" onmouseout=\"ShowAnnotation('');\"";
If you were to add you own output this is where you would substitute the call to your own code.
Eg.
string myProcess = ="onmouseover=\"ShowAssociatedDataTable('{0}');\" onmouseout=\"ShowAssociatedDataTable('');\"";
e.PointPolygon.Attributes=String.Format(myProcess,e.PointPolygon.ValueIndex.ToString());
Whereupon you would use the method ShowAssociatedDataTable to action your call to show the associated data table.
ScrollTool
The ScrollTool adds a scrollbar to the bottom of the WebChart. You may set the visible portion size of the Chart and the start position. The Chart is draggable too though that functionality may be desactivated. The ScrollTool may be used in combination with the Hotspot Tool.
Using the Editor to add a ScrollTool automatically sets the Chart to 2D and moves the lower Axis to permit room for the scrollbar. The scrollbar is not visible at designtime.
Use the ViewSegmentSize and StartPosition in conjunction with SegmentViewUnits to set scrollable size.
Eg.
Steema.TeeChart.Tools.ScrollTool scrollTool =If requiring to use the window onload event please see the Window onload event section.
((Steema.TeeChart.Tools.ScrollTool)WebChart1.Chart.Tools[0]);
scrollTool.StartPosition = 30;
scrollTool.SegmentViewUnits = Steema.TeeChart.Tools.ScrollToolViewUnit.percent;
scrollTool.ViewSegmentSize = 20;
ZoomTool
The ZoomTool permits the selection of a sub area of a Chart to be processed for Zoom. The area may be selected via mousedrag over a Chart area, the zoom co-ordinates are returned to the server to ceate a zoomed zone. The area be be unzoomed by a drag in the opposite direction.
To use the ZoomTool you should add the following method to your page code.
Using Session:
private void CheckZoom(WebChart wChart)or Page.Cache:
{
ArrayList zoomedState=(ArrayList)Session[wChart.ID+"Zoomed"];
zoomedState=((Steema.TeeChart.Tools.ZoomTool)wChart.Chart.Tools[0]).SetCurrentZoom(Request,
zoomedState);
if (zoomedState==null)
Session.Remove(wChart.ID+"Zoomed");
else
Session.Add(wChart.ID+"Zoomed",zoomedState);
}
private void CheckZoom(WebChart wChart)
{
  ArrayList zoomedState = (ArrayList)Page.Cache[wChart.ID + "Zoomed"];
  zoomedState = ((Steema.TeeChart.Tools.ZoomTool)wChart.Chart.Tools[0]).SetCurrentZoom(Request,
    zoomedState);
  if (zoomedState == null)
    Page.Cache.Remove(wChart.ID + "Zoomed");
  else
    Page.Cache.Add(wChart.ID + "Zoomed", zoomedState);
}
Call the method at the end of the Page_Load method, passing the name of the Chart you wish to zoom.
Eg.
CheckZoom(WebChart1);
A click/drag on a Chart without any mouse x or y displacement results in a click being sent back to the server, not a zoom. If requiring to use the window onload event please see the Window onload event section.
Window onload event
When a Zoom or Scroll Tool is added to your WebChart it requires to use the Window.onload event to initialse characteristics of the Tool. If you require to further use the onload event for your own needs then please add a new function to the page called windowOnload and place your code there.
eg. optionally in <HEAD> section of page
<script language=javascript>
function windowOnload()
{
   window.status = new Date().getTime();
}
</script>

